How can AI reshape or enhance the experience of
understanding, using, or exploring geospatial data?
This project explores how artificial intelligence (AI) can be integrated with
geospatial data processing and machine learning to automate
urban real estate
analysis and visualization workflows. By developing a prototype that translates
natural language queries into spatial data operations
and predictive insights,
the project aims to advance computational methods in urban analytics while
providing a foundation for future discussions
on accessibility, bias, and the
role of AI in planning decision-making.
Ben Shneiderman - Human-Centered AI
“The future is not AI versus humans. The future is AI with humans, working together.”
Kate Crawford - Algorithmic Bias
“Biases and blind spots exist in big data … Yet there is a problematic belief that
bigger data is always better data and that correlation is as good as causation.”
Donna Haraway - Situated Knowledges
“Situated knowledges … allows us to become answerable for what we learn how to see.”
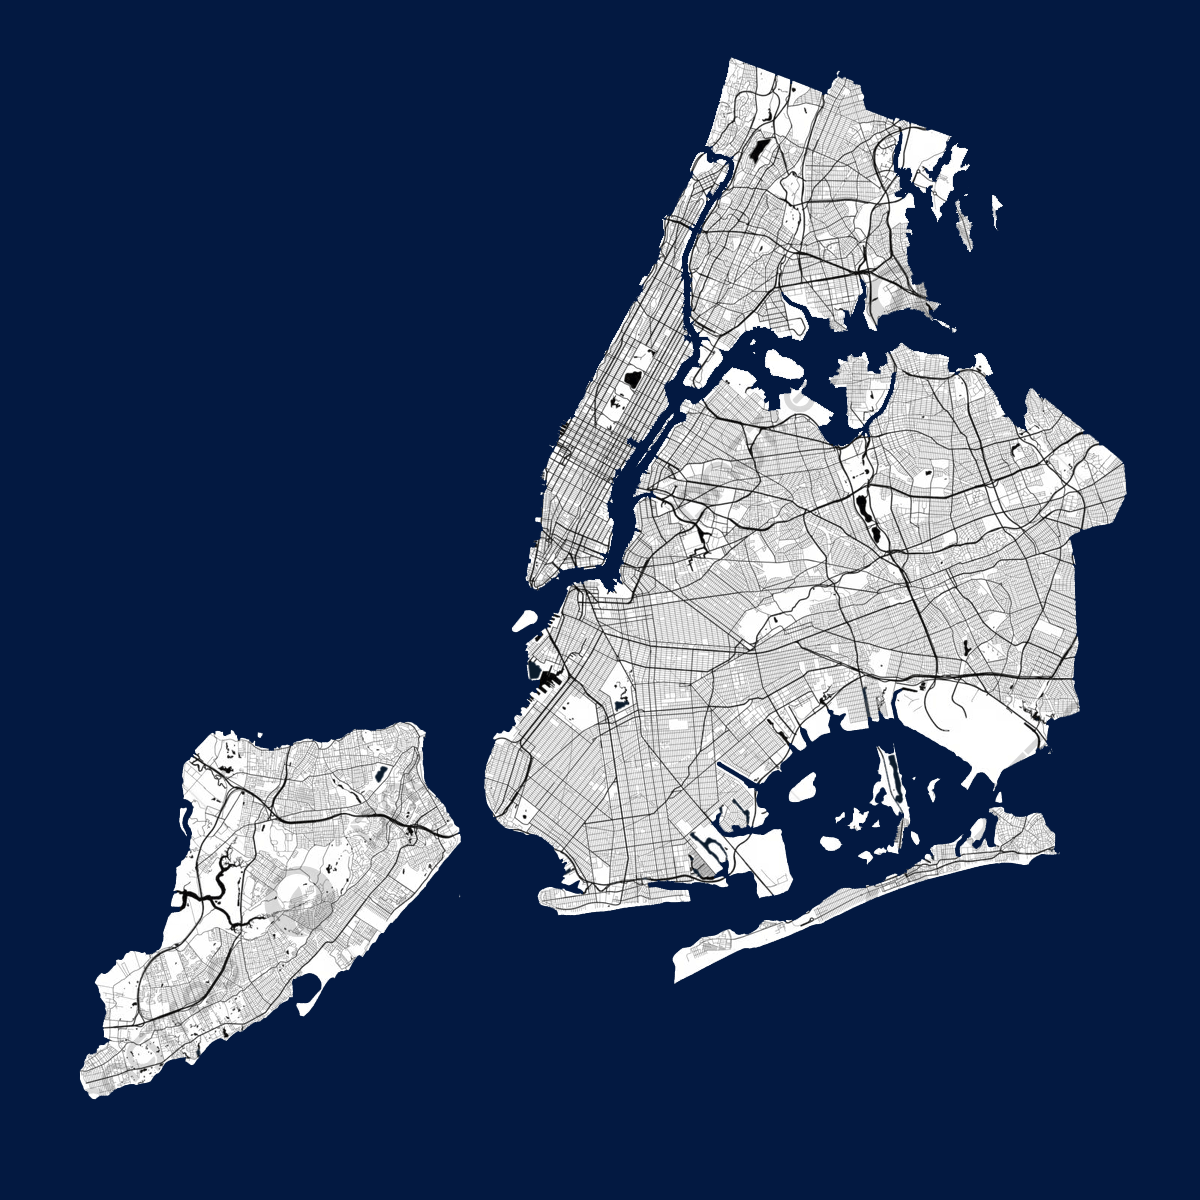
Historical Lineage
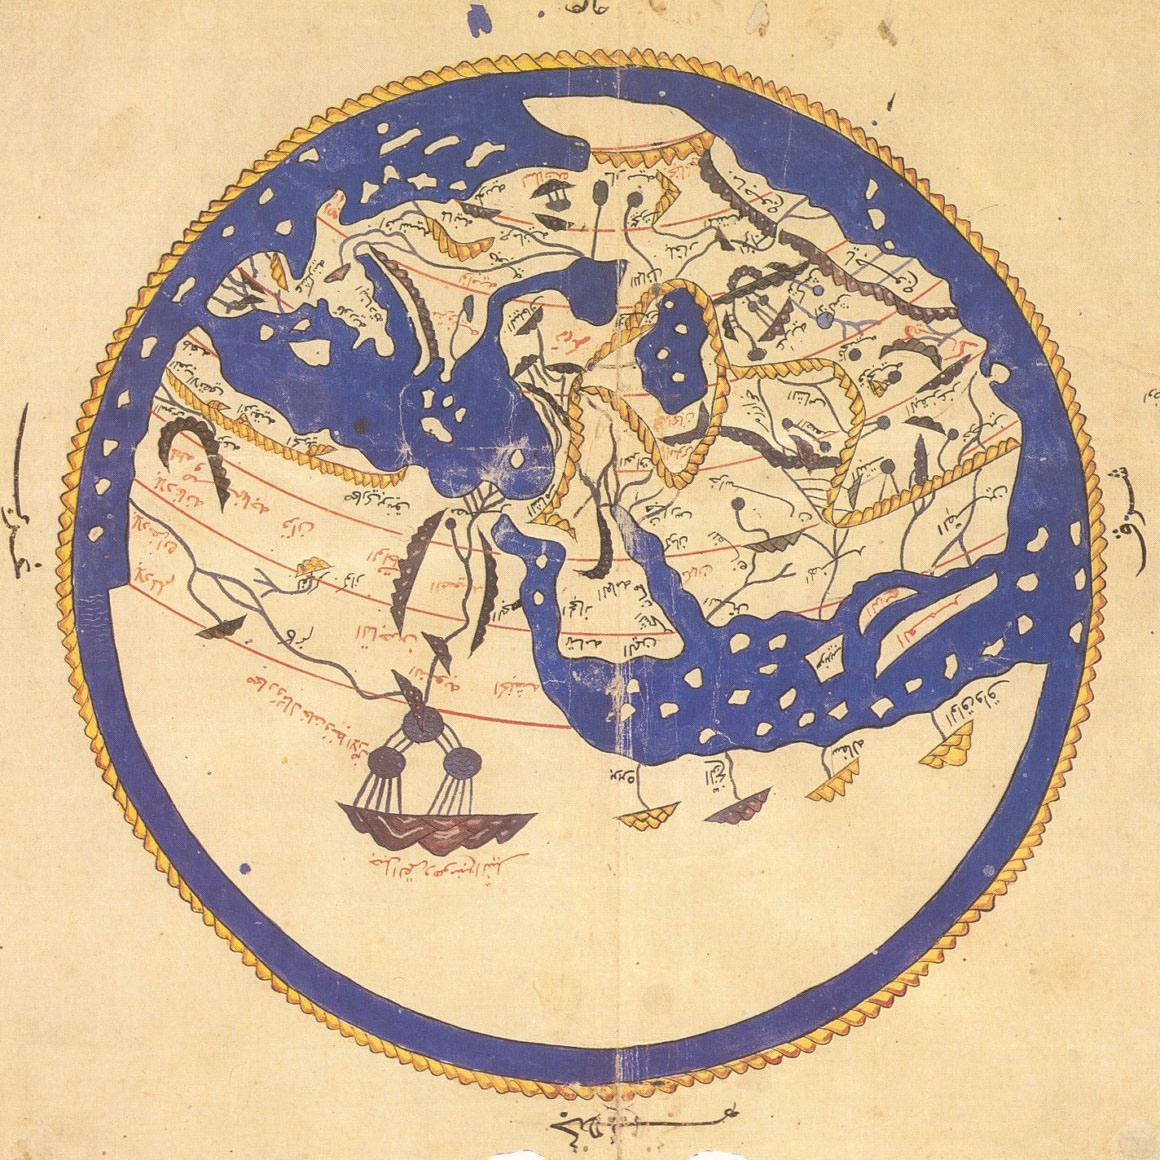
Al-Idrisi created one of the most accurate pre-modern world maps through Synthesizing geographic knowledge from traders, travelers, and explorers into a structured world view
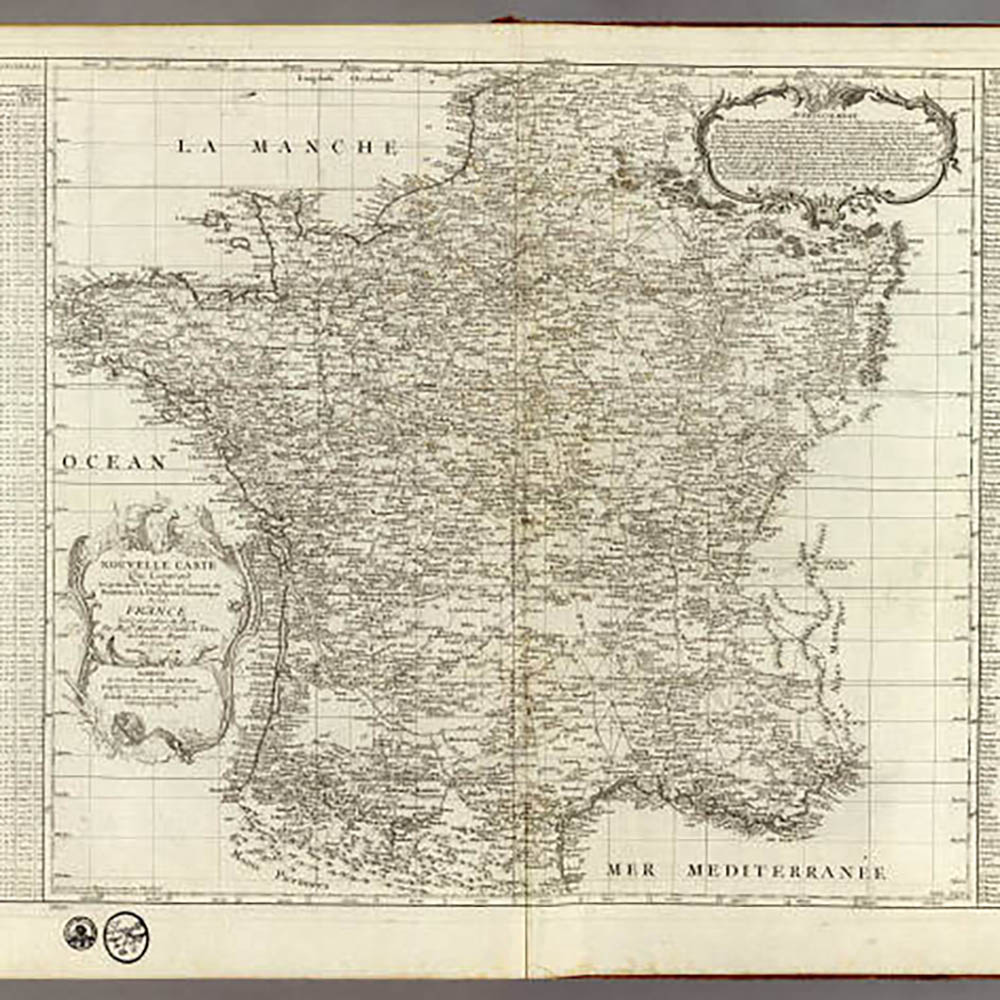
Jean-Dominique Cassini developed the first topographic map of an entire France (France) based on systematic triangulation. The result of the map is much more accurate than maps generated by surveying and traveling.
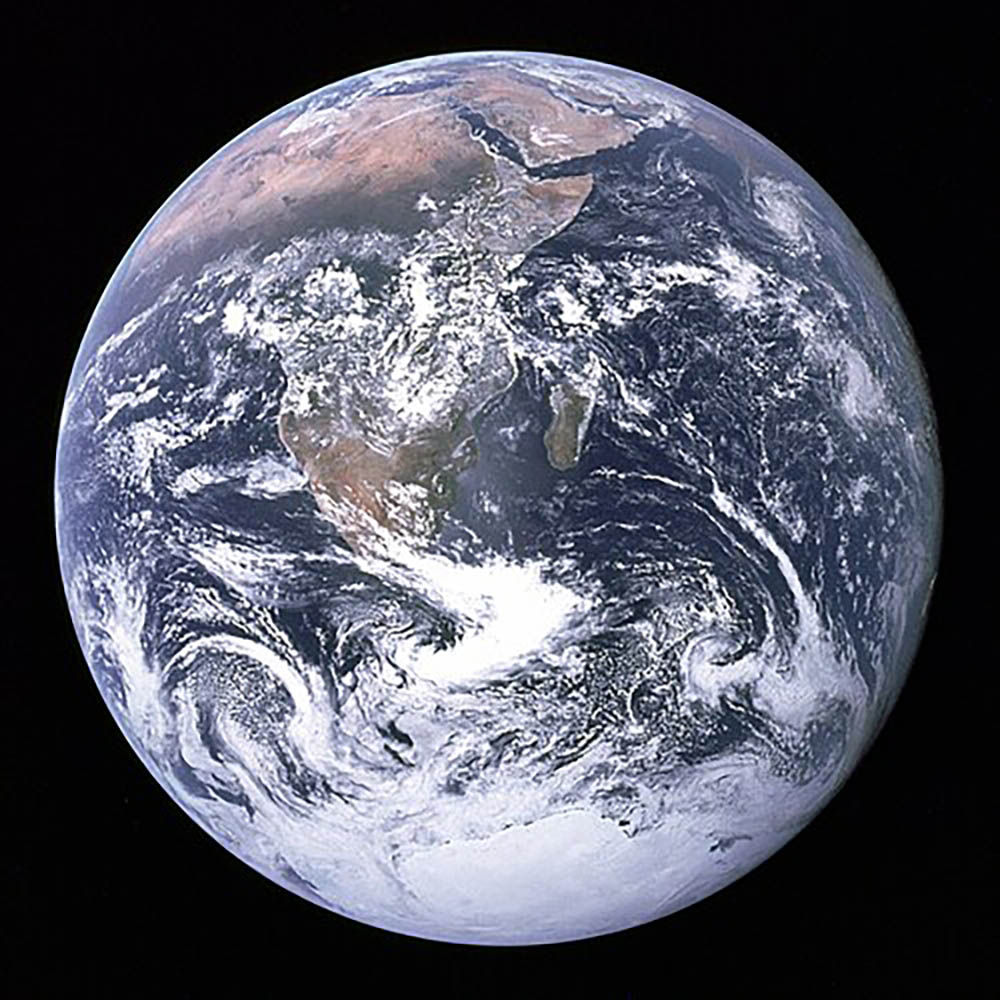
The Blue Marble is the first and the most famous Earth image. It became a symbol of global awareness, influencing environmentalism, planetary-scale science, and eventually global GIS thinking
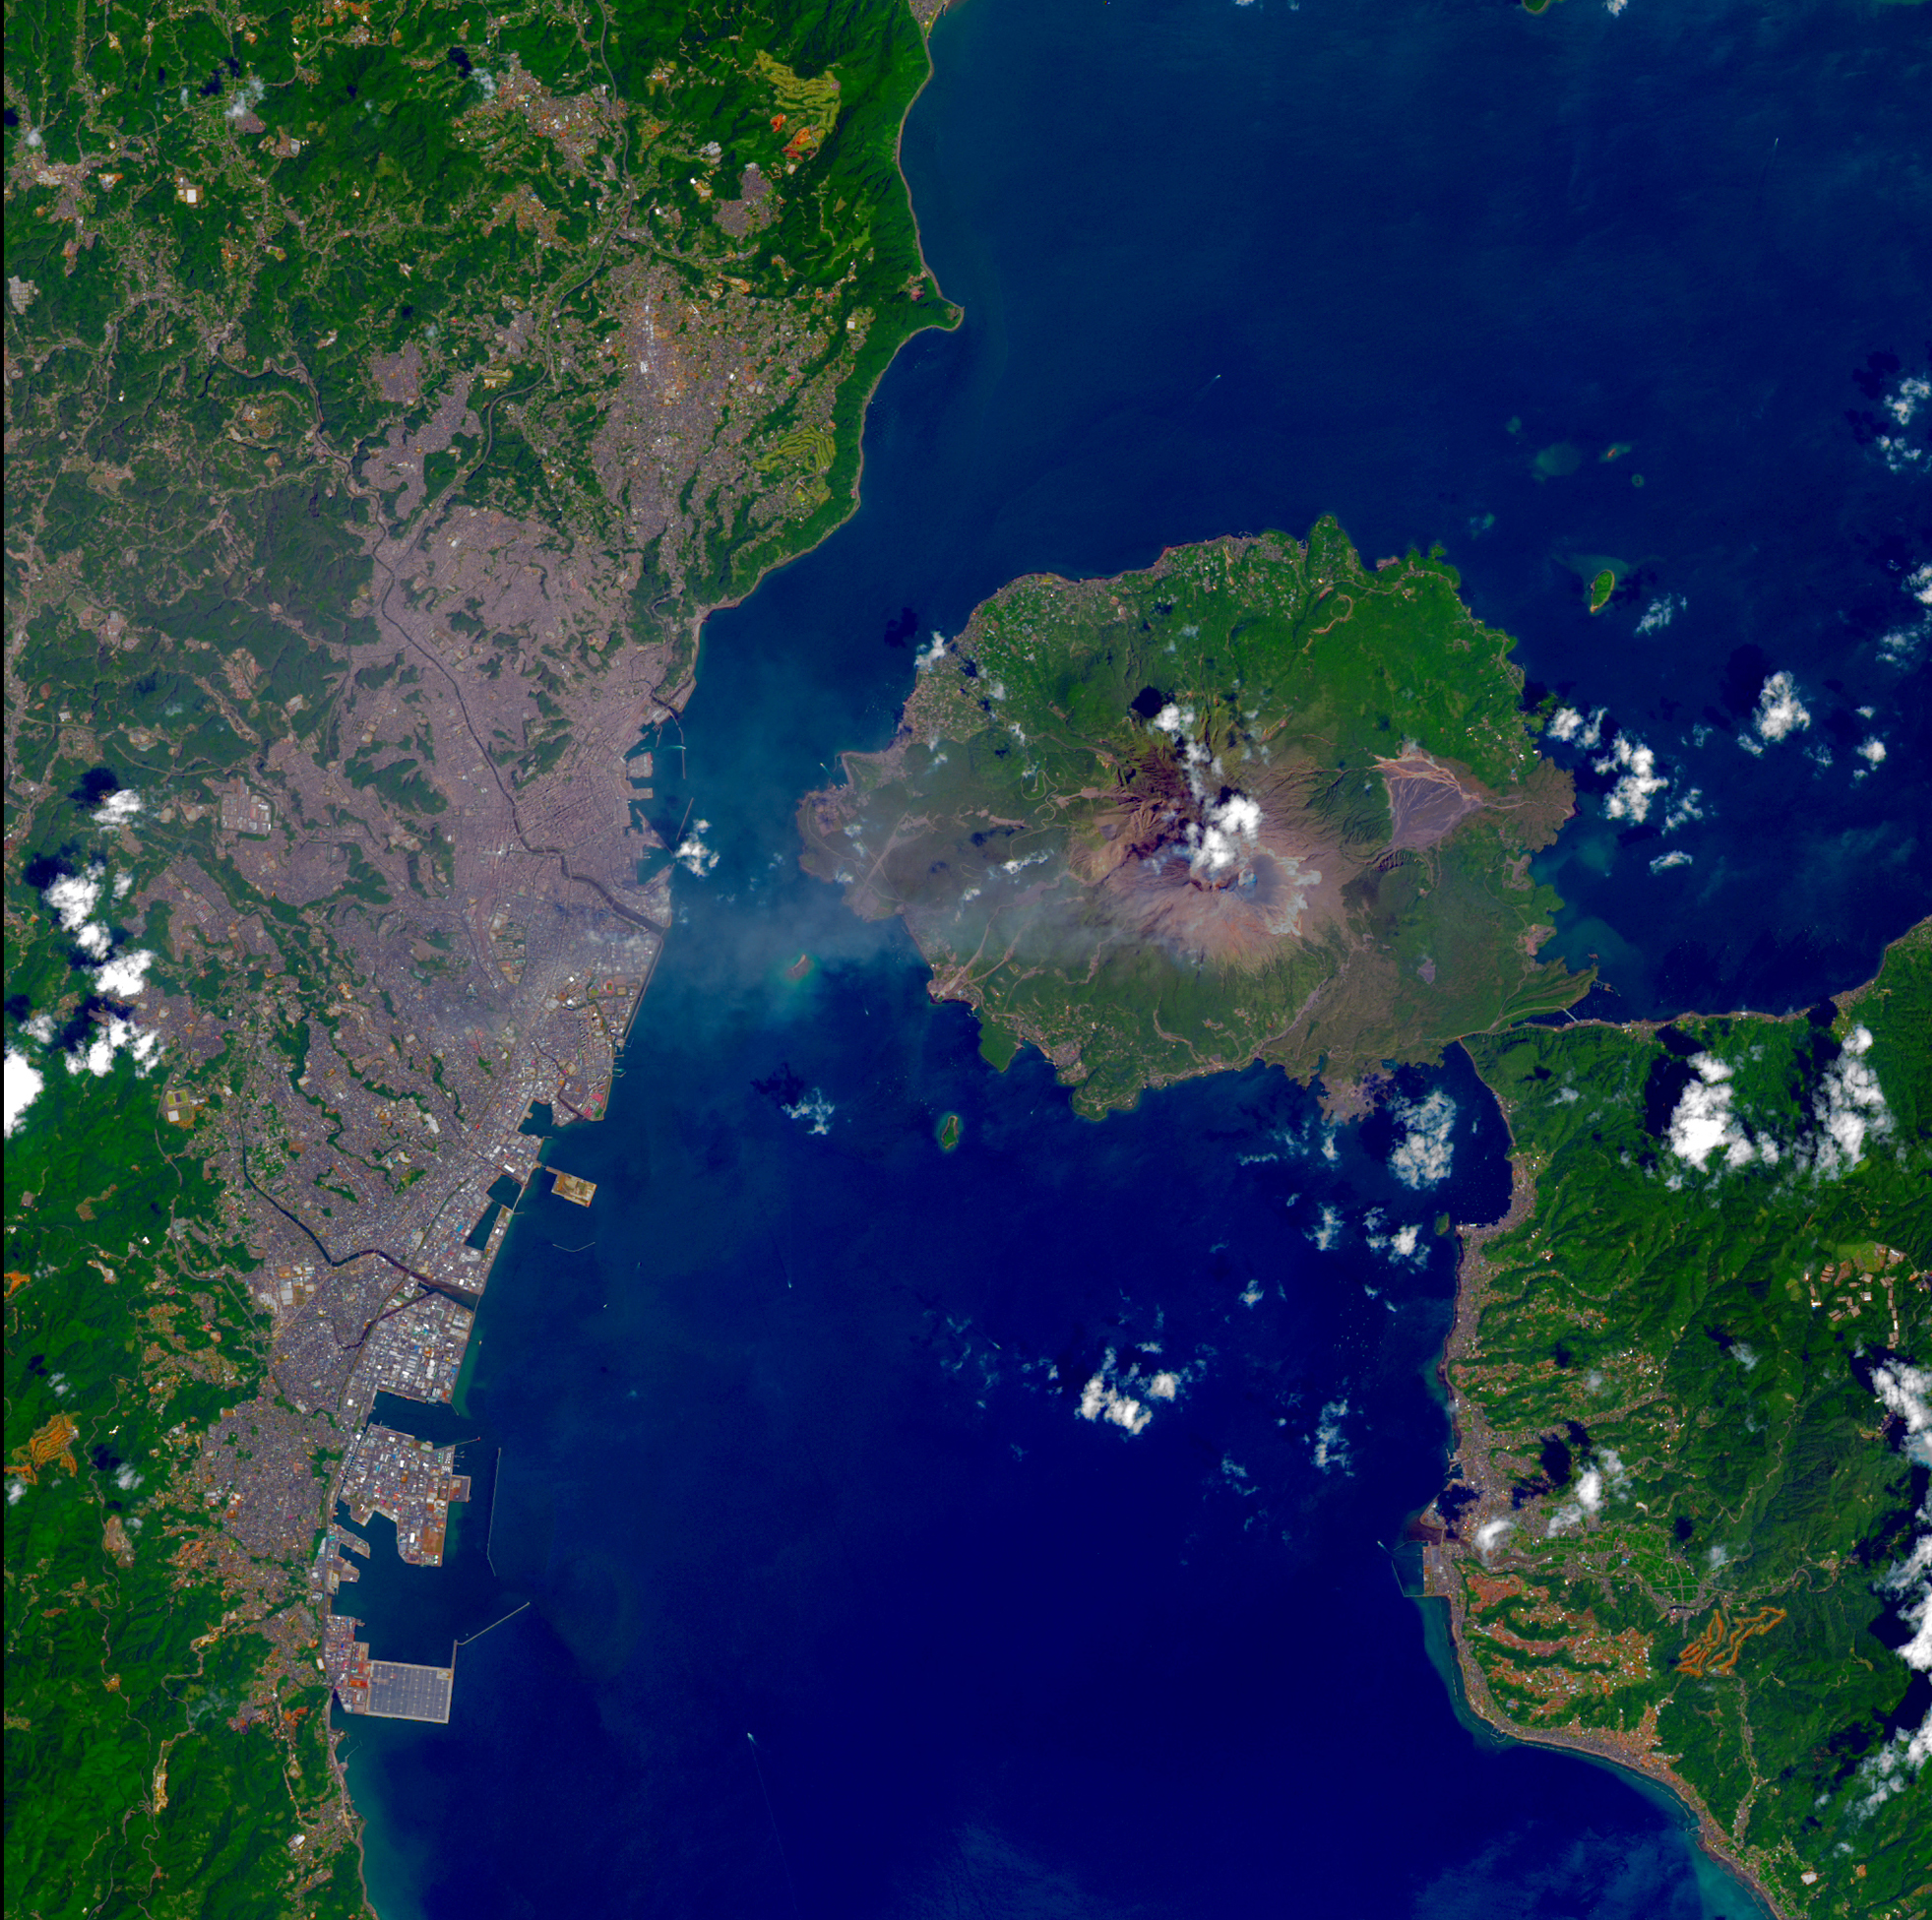
Satellite techonology enabled consistent, multispectral satellite imagery of Earth's surface for agriculture, urbanization, deforestation, etc. For every updated landsat, the images of the Earth is becoming much more accurate, and detailed.
LLM Query Method Exploration
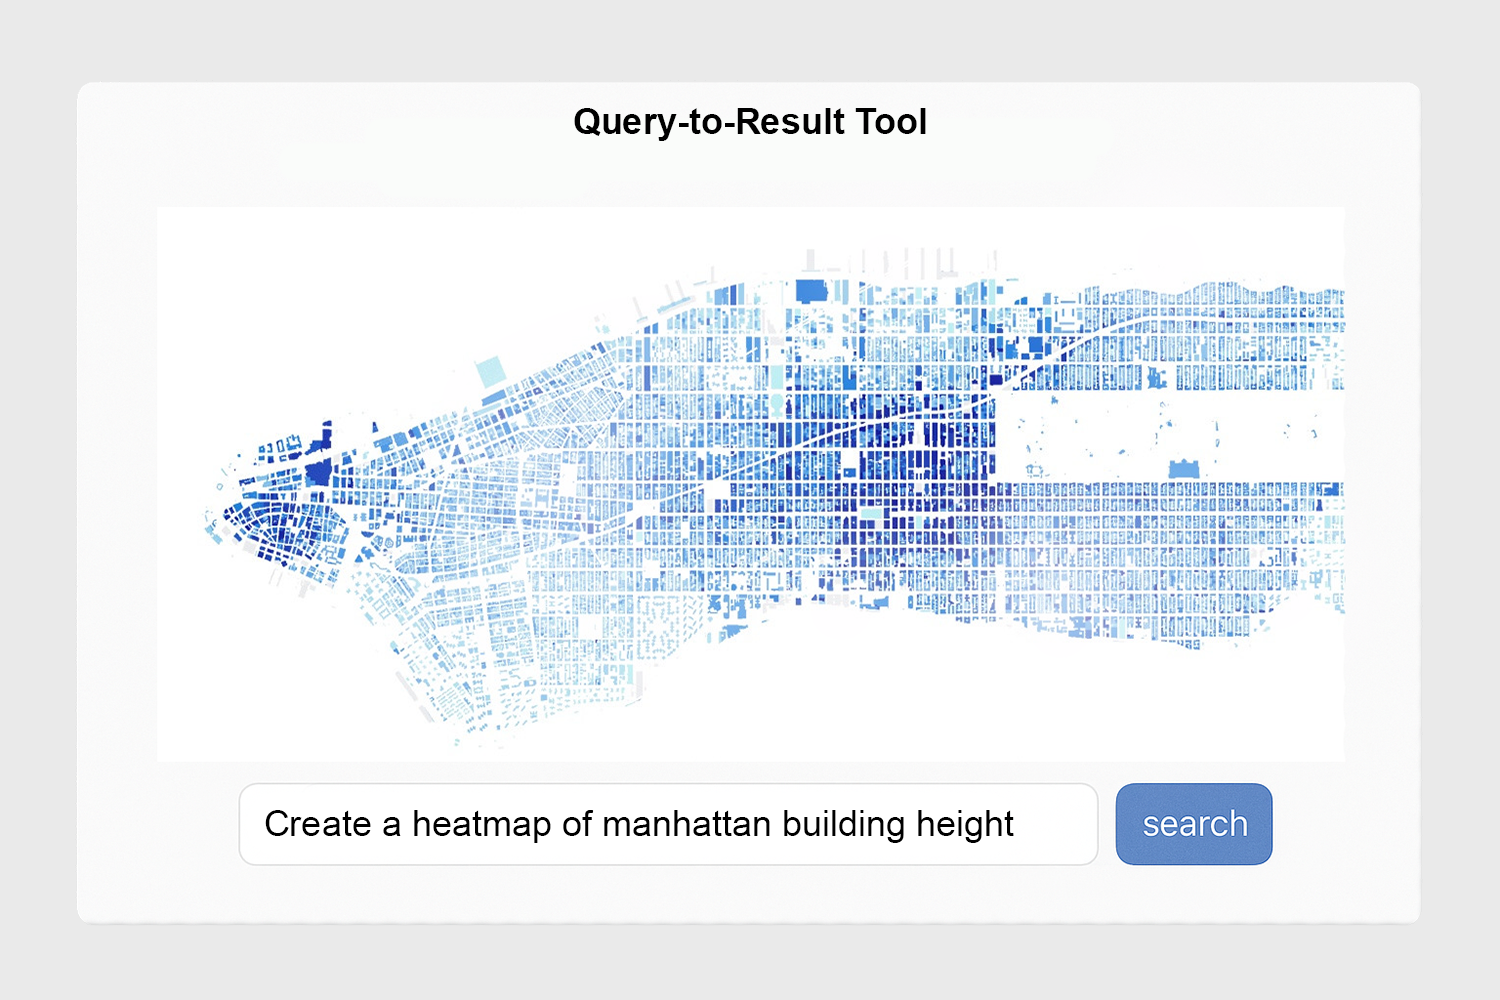

Temporary Proposal: Query-to-Result Tool
 Group 1
Geometry Data
(shp, geojson)
 Group 2
Feature Data
(csv)
 Group 3
Analytical Models
(python)
 Group 4
Visualization Script
(python or js)
"Compare building height and property value in NYC flood zones."
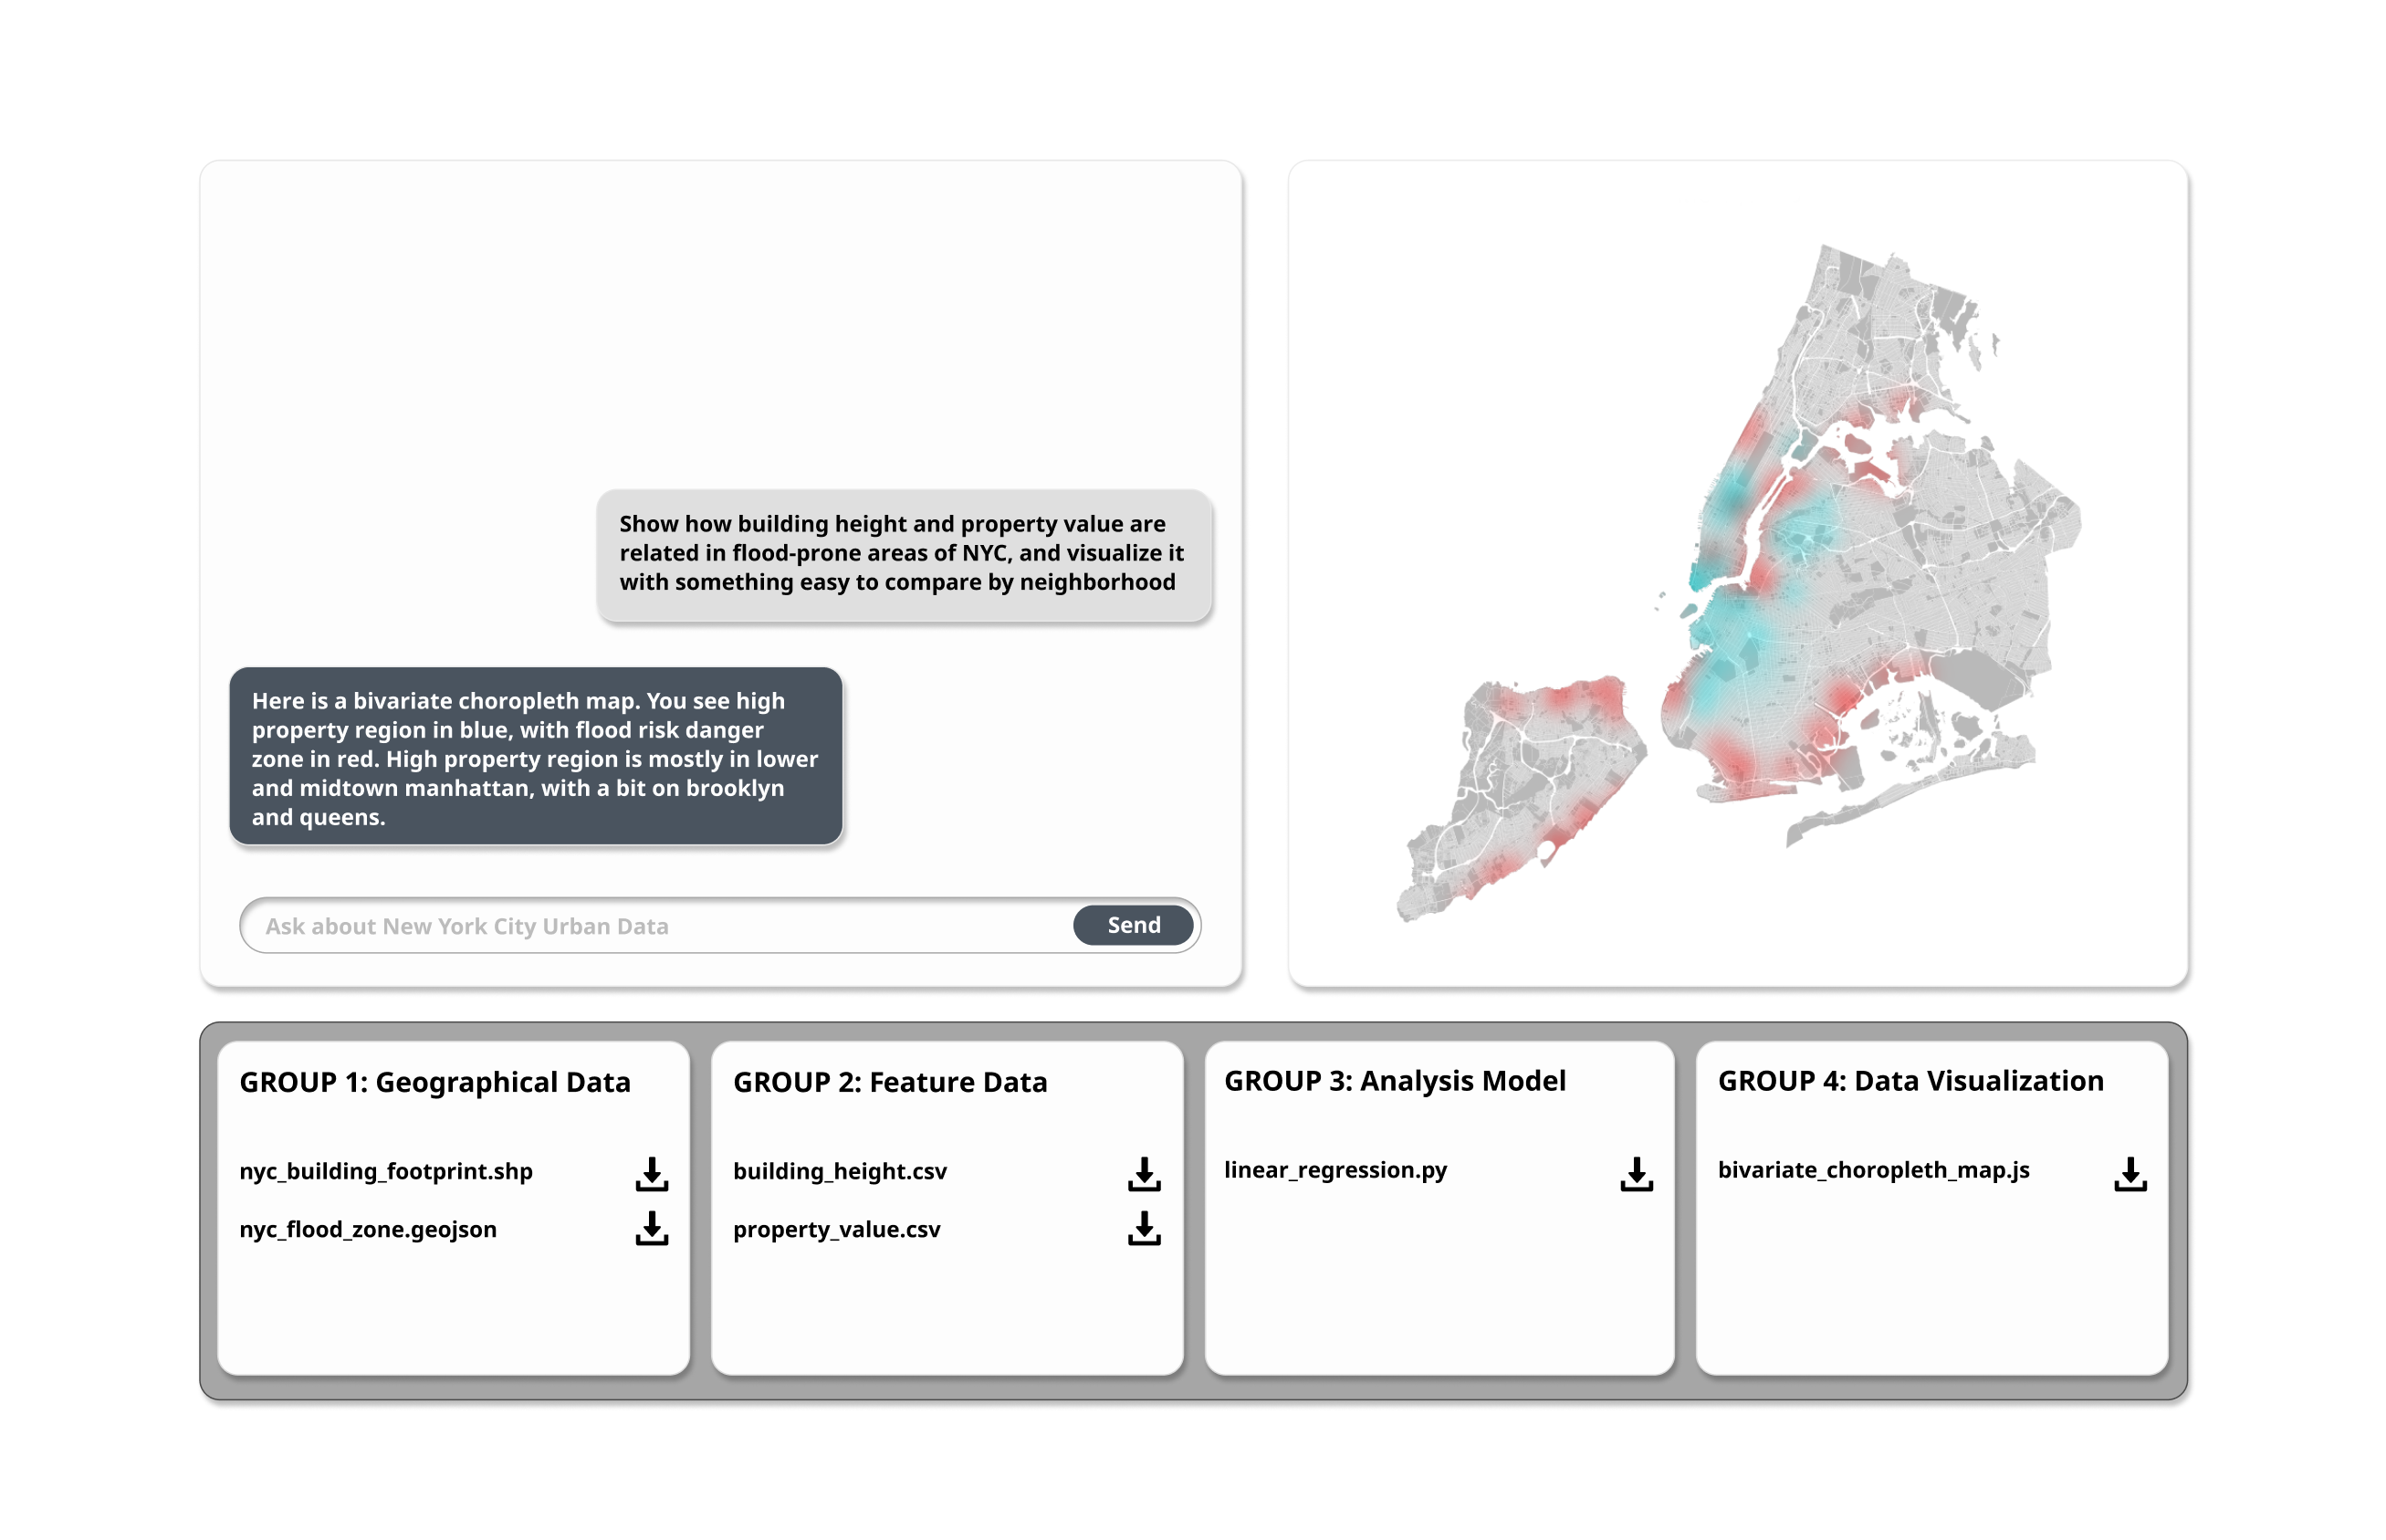
Sample User Interface for the Geospatial Query Tool